Suppose you want your report readers to be able to look at overall sales metrics, but also highlight performance for individual district managers and different time frames. You could create separate reports or comparative charts. You could add filters in the Filters pane. Or you could use slicers. Slicers are another way of filtering. They narrow the portion of the dataset that is shown in the other report visualizations.

This article walks through creating and formatting a basic slicer, using the free Retail Analysis Sample. It also covers controlling which visuals are affected by a slicer, syncing with slicers on other pages, and filtering and formatting slicers.
These other articles explain how to make specific types of slicers:
- Numeric range slicers.
- Relative date slicers.
- Relative time slicers.
- Responsive, resizable slicers.
- Hierarchy slicers with multiple fields.
When to use a slicer
Slicers are a great choice when you want to:
- Display commonly used or important filters on the report canvas for easier access.
- Make it easier to see the current filtered state without having to open a drop-down list.
- Filter by columns that are unneeded and hidden in the data tables.
- Create more focused reports by putting slicers next to important visuals.
Power BI slicers don’t support:
- Input fields
- Drill-down options
Create a slicer
This slicer filters data by district manager. If you want to follow along with this procedure, download the Retail Analysis Sample PBIX file.
- Open Power BI Desktop, and from the menu bar, select File > Open report.
- Browse to the Retail Analysis Sample PBIX.pbix file, then select Open.
- On the left pane, select the Report icon
 to open the file in report view.
 - On the Overview page, with nothing selected on the report canvas, select the Slicer icon
 in the Visualizations pane to create a new slicer.
 - With the new slicer selected, from the Fields pane, expand the District table and select DM to populate the slicer.The new slicer is now populated with a list of district manager names and their selection boxes.
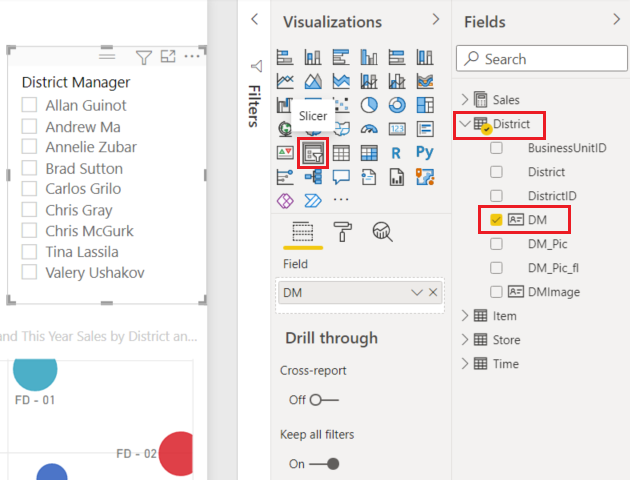
- Resize and drag the elements on the canvas to make room for the slicer. If you resize the slicer too small, its items are cut off.
- Select names on the slicer and notice the effects on the other visualizations on the page. Select names again to deselect them, or hold down the Ctrl key to select more than one name. Selecting all names has the same effect as selecting none.
- Alternately, select Format (paint roller icon) in the Visualizations pane to format your slicer.There are too many options to describe them all here; experiment and create a slicer that works for you. In the following image, the first slicer has a horizontal orientation and colored backgrounds for the items. The second slicer has a vertical orientation and colored text for a more standard look.
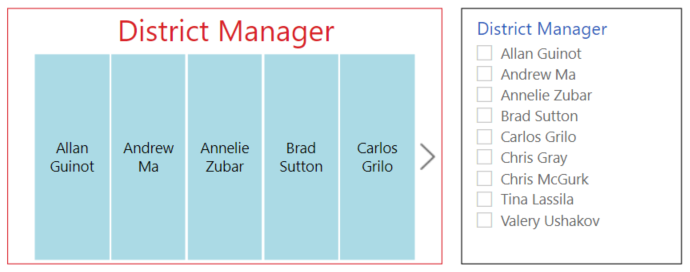 TipSlicer list items are sorted in ascending order, by default. To reverse the sort order to descending, select the ellipsis (…) in the top right corner of the slicer and choose Sort descending.
Control which page visuals are affected by slicers
By default, slicers on report pages affect all the other visualizations on that page, including each other. As you choose values in the list and date slicers that you just created, notice the effects on the other visualizations. The filtered data is an intersection of the values selected in both slicers.
Use visual interactions to exclude some page visualizations from being affected by others. On the Overview page, the Total Sales Variance by FiscalMonth and District Manager chart shows overall comparative data for district managers by month, which is information that you want to keep visible. Use visual interactions to keep slicer selections from filtering this chart.
- Go to the Overview page of the report, and then select the DM slicer you previously created.
- On the Power BI Desktop menu, select the Format menu under Visual Tools, and then select Edit interactions.Filter controls,
 each with a Filter and a None option, appear above all the visuals on the page. Initially, the Filter option is preselected on all the controls.
 - Select the None option in the filter control above the Total Sales Variance by FiscalMonth and District Manager chart to stop the DM slicer from filtering it.
For more information about editing interactions, see Change how visuals interact in a Power BI report.
Sync and use slicers on other pages
You can sync a slicer and use it on any or all pages in a report.
In the current report, the District Monthly Sales page has a District Manager slicer, but what if we also wanted that slicer on the New Stores page? The New Stores page has a slicer, but it provides only Store Name information. With the Sync slicers pane, you can sync the District Manager slicer to these pages, so that slicer selections on any page affect visualizations on all three pages.
- In Power BI Desktop on the View ribbon, select Sync slicers.
 Or in the Power BI service, on the View menu, set the Sync slicers pane to On.
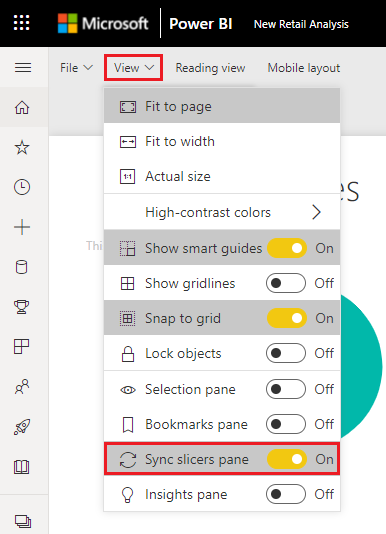 The Sync slicers pane appears between the Filters and Visualizations panes.
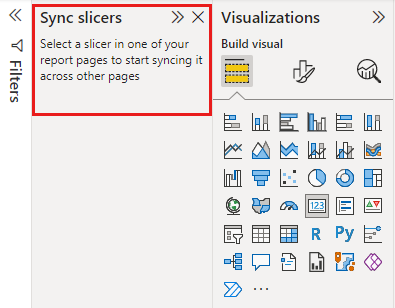
- On the District Monthly Sales page of the report, select the District Manager slicer.Because you’ve already created a District Manager (DM) slicer on the Overview page, the Sync slicers pane appears as follows:
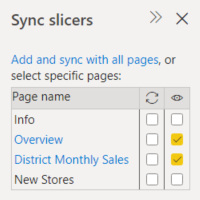
- In the Sync column of the Sync slicers pane, select the Overview, District Monthly Sales, and New Stores pages.This selection causes the District Monthly Sales slicer to sync across these three pages.
- In the Visible column of the Sync slicers pane, select the New Stores page.This selection causes the District Monthly Sales slicer to be visible in these three pages. The Sync slicers pane now appears as follows:
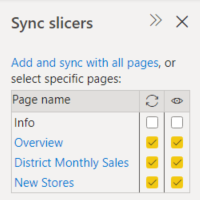
- Observe the effects of syncing the slicer and making it visible on the other pages. On the District Monthly Sales page, notice that the District Manager slicer now shows the same selections as on the Overview page. On the New Stores page, the District Manager slicer is now visible and it selections affect the selections that are visible in the Store Name slicer. TipAlthough the slicer initially appears on the synced pages at the same size and position as on the original page, you can move, resize, and format synced slicers on the various pages independently. NoteIf you sync a slicer to a page but don’t make it visible on that page, slicer selections made on the other pages still filter the data on the page.
Sync separate slicers
You can also sync two or more separate slicers. This is particularly useful when working with composite models, as you might want to make the same selection across sources without relying on cross-source group relationships. To sync two or more separate slicers, you mark them as being part of a group.
- Make sure the Sync slicers pane is visible by selecting it from the View menu.

- Select one of the slicers that you want in the group. In the Sync slicers pane, expand Advanced options, and enter a name for the group. You can name it anything you want.
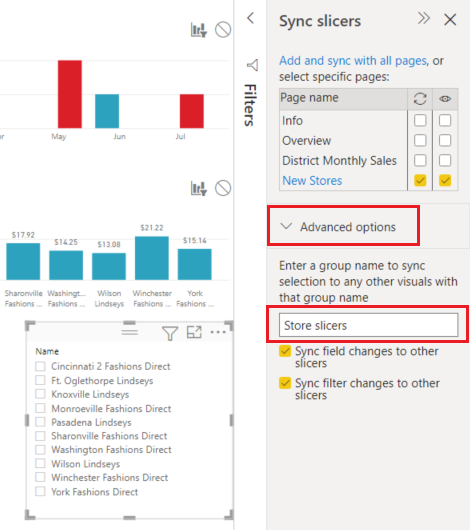
- Then select another slicer you want to sync with the first, and enter the same name in the group name box. Be sure to enter it exactly the same.
- Make sure to select either Sync field changes to other slicers, Sync filter changes to other slicers or both depending on your scenario.
- If you just want to keep the slicers in sync so filters set by the slicers are kept in sync, select Sync filter changes to other slicers.
- If you also want to make sure that any changes you make to the field on which the slicers are based get synced across the group, select Sync field changes to other slicers.
- Test that the sync works the way you want by changing the selection in one of the slicers. Observe that it gets updated in the other slicer in the group.
Filtering slicers
You can apply visual-level filters to slicers to reduce the list of values that are displayed in the slicer. For example you might filter out blank values from a list slicer, or filter out certain dates from a range slicer. When you do this it only affects the values that are shown in the slicer, not the filter that the slicer applies to other visuals when you make a selection. For example, let’s say you apply a filter to a range slicer to only show certain dates. The selection on the slicer will only show the first and last dates from that range, but you would still see other dates in your other visuals. Once you change the selected range in the slicer, you’ll see the other visuals update. Clearing the slicer would show all the dates again.
For more information on visual-level filters, see Filter types.
Format slicers
Different formatting options are available, depending on the slicer type. By using Horizontal orientation, Responsive layout, and Item coloring, you can produce buttons or tiles rather than standard list items, and make slicer items resize to fit different screen sizes and layouts.
- With the District Manager slicer selected on any page, in the Visualizations pane, select the Format icon
 to display the formatting controls.
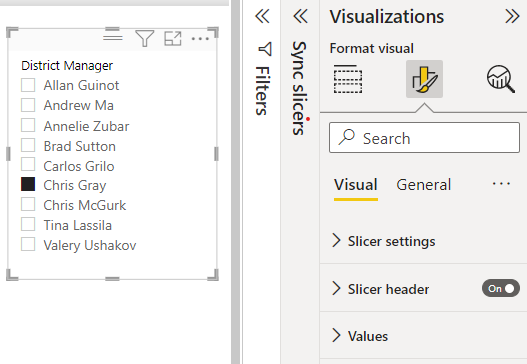
- Select the drop-down arrows next to each category to display and edit the options.
General options
- Under Format, select General, select a red color under Outline color, and then change Outline weight to 2.This setting changes the color and thickness of the header and item outlines and underlines.
- For Orientation, Vertical is selected by default. Select Horizontal to produce a slicer with horizontally arranged tiles or buttons, and scroll arrows to access items that don’t fit in the slicer.
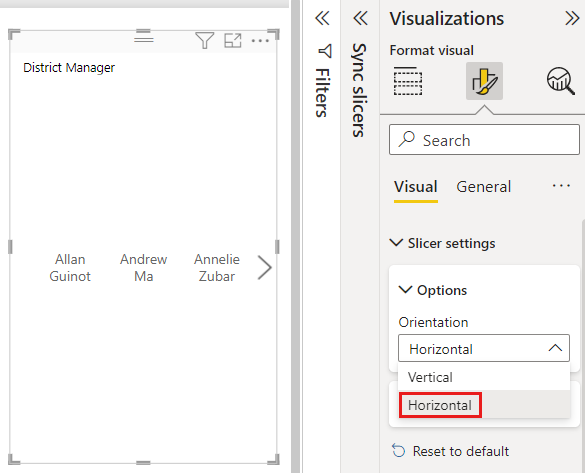
- Turn On the Responsive layout to change the size and arrangement of slicer items according to the view screen and slicer size.For list slicers, responsive layout prevents items from being cut off on small screens. It’s available only in horizontal orientations. For range slider slicers, responsive formatting changes the style of the slider and provides more flexible resizing. Both types of slicers become filter icons at small sizes.
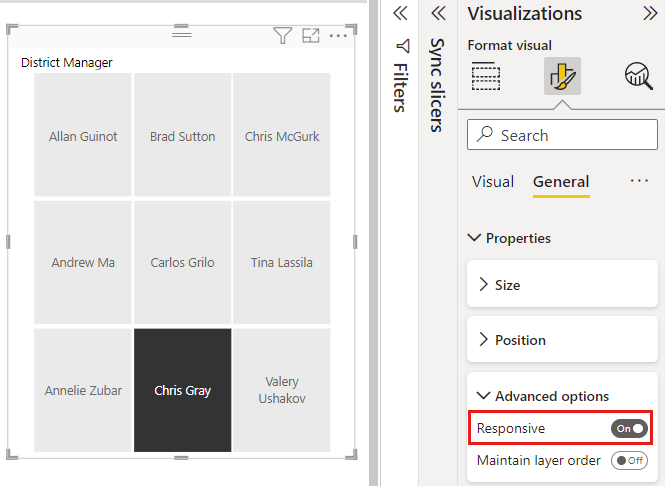 NoteResponsive layout changes can override specific heading and item formatting that you set.
 - Under X Position, Y Position, Width, and Height, set the slicer position and size with numeric precision, or move and resize the slicer directly on the canvas.Experiment with different item sizes and arrangements, and note how the responsive formatting changes accordingly. These options are available only when you select horizontal orientations.

For more information about horizontal orientations and responsive layouts, see Create a responsive slicer you can resize in Power BI.
Selection controls options (list slicers only)
- Under Selection controls, turn Show “Select all” option to On to add a Select all item to the slicer.Show “Select all” option is Off by default. When enabled, this option, when toggled, selects or deselects all items. If you select all items, selecting an item deselects it, allowing an is-not type of filter.
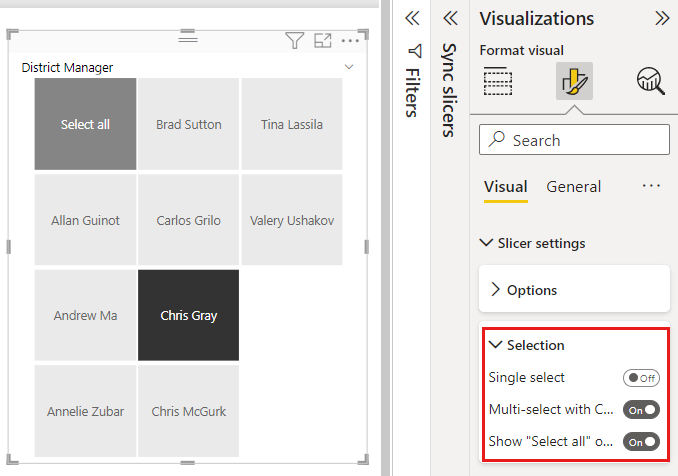
- Turn Single select to Off to allow you to select multiple items without needing to hold down the Ctrl key.Single select is On by default. Selecting an item selects it, and holding down the Ctrl key selects multiple items. Selecting an item again deselects it.
Title options
Title is On by default. This selection shows the data field name at the top of the slicer. You can edit the title, too, which is especially useful for hierarchy slicers. See Change the title in the article “Add multiple fields to a hierarchy slicer” for details.
- For this article, format the title text as follows:
- Font color: red
- Text size: 14 pt
- Alignment: Center
- Font family: Arial Black
Items options
Items options are only available for list slicers.
- For this article, format the Items options as follows:
- Font color: black
- Background: light red
- Text size: 10 pt
- Font family: Arial
- For Outline, choose Frame to draw a border around each item with the size and color you set under the General options.
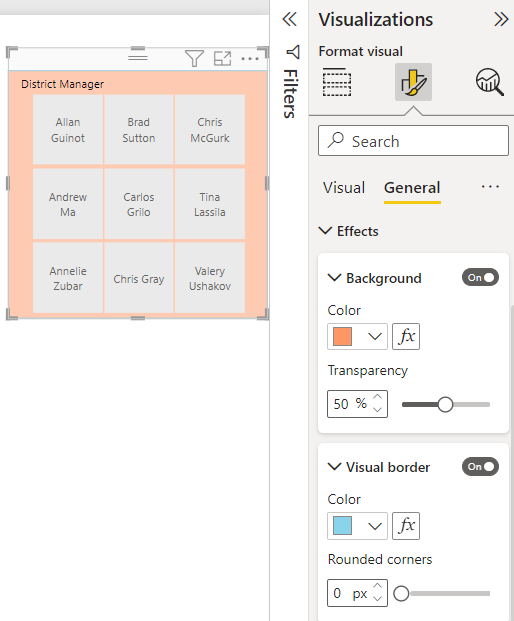 Tip
Tip- With General > Orientation > Horizontal selected, deselected items show the chosen text and background colors. Selected items use the system default, usually a black background with white text.
- With General > Orientation > Vertical selected, items always show the selected colors, and check boxes are always black when selected.
Date/numeric inputs and slider options
Date/numeric inputs and slider options are only available for range slider slicers.
- For list slicers, date/numeric input options are the same as Items options except that there’s no outline or underline options.
- Slider options allow you to set the color of the range slider, or turn the slider to Off, leaving only the numeric inputs.
Other formatting options
The other formatting options are Off by default. Turn On these options to control them:
- Background: Add a background color to the slicer and set its transparency.
- Lock aspect: Keep the relative height and width of the slicer if it’s resized.
- Border: Add a border around the slicer and set its color. This slicer border is separate from and unaffected by the General settings.
- Shadow: Add a drop shadow to the slider.
Ref: https://docs.microsoft.com/en-us/power-bi/visuals/power-bi-visualization-slicers#control-which-page-visuals-are-affected-by-slicers