
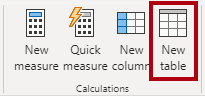
2. On the Home ribbon tab, from inside the Calculations group, click New Table.
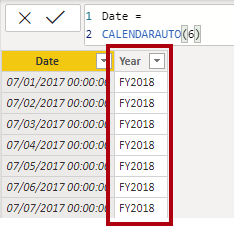
3. In the formula bar, enter the following, and then press Enter:
Date =
CALENDARAUTO(6)
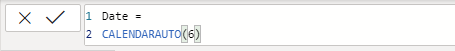
This function can take a single optional argument which is the last month number of a year. When omitted, the value is 12, meaning that December is the last month of the year. In this case, 6 is entered, meaning that June is the last month of the year.
Notice the column of date values.
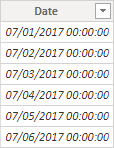
If the column does not appear, in the Fields pane, select a different table, and then select the Date table.
or you may want to use the CALENDAR function. like
DATE = CALENDAR (DATE (2020,07,01), DATE (2025,06,30))
At the bottom-left corner, in the status bar, notice the table statistics, confirming that 1826 rows of data have been generated, which represents five full years’ data.

In the formula bar, type the following, and then press Enter:
Year = "FY" & YEAR('Date'[Date]) + IF(MONTH('Date'[Date]) > 6, 1)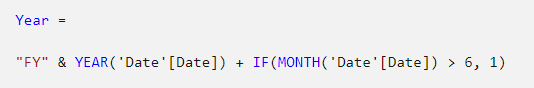
A calculated column is created by first entering the column name, followed by the equals symbol (=), followed by a DAX formula that returns a single-value result. The column name cannot already exist in the table.
The formula uses the date’s year value but adds one to the year value when the month is after June. This is how fiscal years at Adventure Works are calculated.
5. Create the following two calculated columns for the Date table:
- Quarter
- Month
Quarter =
‘Date'[Year] & ” Q”
& IF(
MONTH(‘DATE'[DATE]) <= 3,
3
IF(
MONTH(‘DATE'[DATE]) <= 6,
4
IF(
MONTH(‘DATE'[DATE]) <= 9,
1,
2
)
)
)
Month =
FORMAT(‘Date'[Date], “yyyy MMM”)

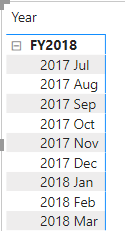
By default, text values sort alphabetically, numbers sort from smallest to largest, and dates sort from earliest to latest.
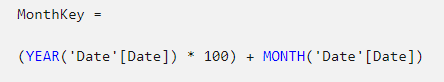
6. Add the MonthKey column to the Date table. This formula computes a numeric value for each year/month combination.
MonthKey = (YEAR(‘Date'[Date]) * 100) + MONTH(‘Date'[Date])

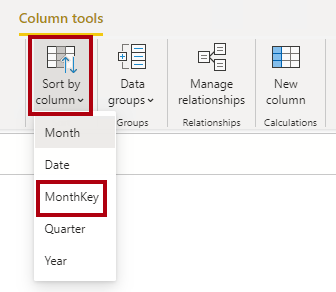
7. On the Column Tools contextual ribbon, from inside the Sort group, click Sort by Column and then select MonthKey.
Ref: Lab – Introduction to DAX in Power BI Desktop – Learn | Microsoft Docs