Please do as per directed to generate a table with the help from another table. We will make use of a calculated table to achieve this. A calculated table is a calculated data object created by a DAX query or expression which is derived from a part or whole of the table. We can also use more than one table to make a calculated table but there must be at least one existing one.
First click on the “New Table” option which you can find under “Modelling” tab

- A Power BI DAX formula bar will open where you can write and execute DAX expression
- Assume the previous table, named Sales had 3 columns: Order Id, Order_No, Order_Date
- We will put in the following DAX Expression:

Item = SUMMARIZE (Sales, Sales[item_id], Sales[Item_No])
You can also make use of the SELECT COLUMN function to make a subset instead of grouping them
- SELECTCOLUMNS(Sales, “Id and No”, [item_id]&”, “&[item_no])
- Execute the above query and you will have another Table summarized columns designed by the name parameters.
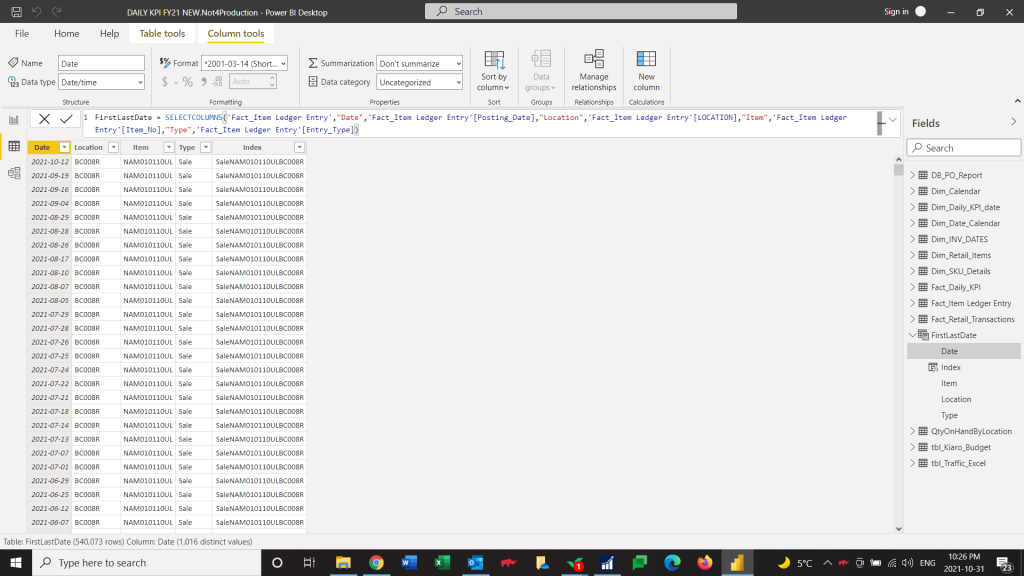
Below, another sample of SelectColuns for reference.
Continue to the above sample, if you want to have the most recent record only. Then SUMMARIZE is the one that can do the job for you.

Now, you can see the records is reduced from 540K to only 30K rows.