Bottom line: Is the font too small and difficult to read in your reports? In this post and video I share tips for changing the page zoom and text size in your Power BI charts and visuals.
In the video above I explain how to make your reports and visuals more readable by changing the text size or page zoom. There are several ways to make things bigger, and I will explain each one below.
1. Change the zoom on the page.
If the setting for the page size is set to “Fit to Page,” you can change it to “Actual Size” to make it bigger. Just go to the View tab on the Ribbon and select “Actual Size” from the Page View drop-down menu.
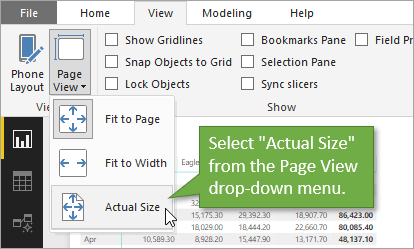
You’ll notice that this creates both a horizontal and vertical scroll bar so that you can scroll to see the rest of the page (even if the rest of the page is blank).
2. Change the size of the page to a custom size.
Start by clicking anywhere on the page that doesn’t have a visual. Under the Visualizations pane (on the right of the screen) there is an icon that looks like a paint roller. This is the Format button. Click that to view the Format menu, from which you can choose Page Size. Under Type, choose Custom.

The default will be set at 1280×720 pixels, but you can decrease those numbers to see the text in your visual more clearly.
Just be aware that if you’ve made your page size smaller, you obviously won’t be able to fit as much on the page as you normally would.
3. Quickly change the text size of all the elements in a visual using the search feature.
Another option is to change the text sizes within the visual itself. Each element of the visual (headers, subtotals, values, etc.) has controls for text size, so you are able to change some or all of them to achieve the desired look.
To quickly see all of your options when it comes to text size, you can use the search bar. Just type “text size” into the search bar, and it will return all of the text size options for each property of the visual.
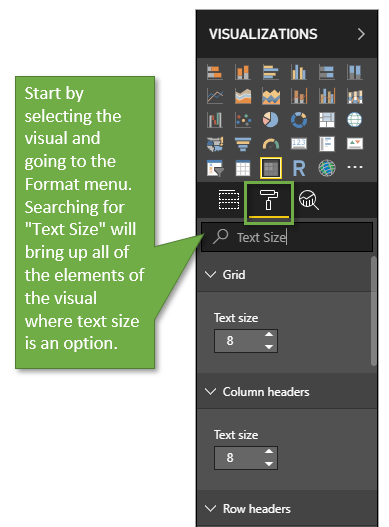
4. Change the text size of all elements/components in the Matrix visual.
If the visual you are changing is Matrix style, you can change the text size for all of the visual’s components simultaneously by changing the Grid element.
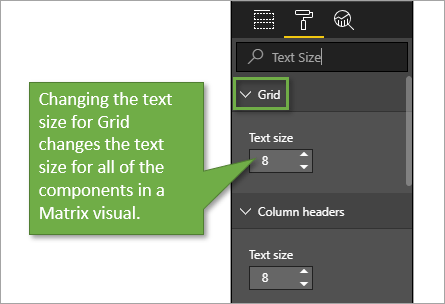
Just know that if you previously changed the text size of some of the other components, when you change the text size for Grid, it will override those previous changes.
5. Quickly change the text or font size on multiple visuals on a page.
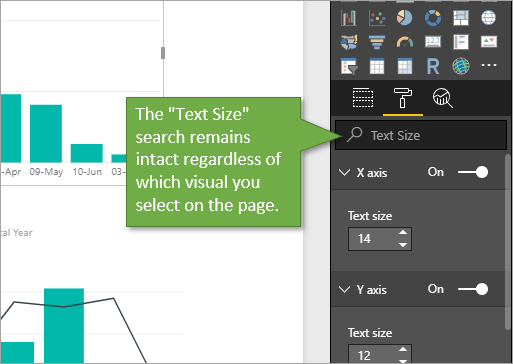
One cool feature about Power BI is that when you’ve searched for “Text Size” for one visual on your page, that search doesn’t go away when you click on another visual. That means you can quickly change multiple visuals just by hopping from one visual to the next and adjusting the text sizes you want.
6. Use themes to change the text size of all visuals.
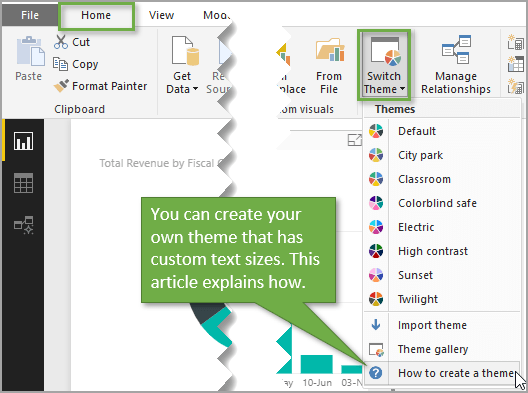
If changing text sizes is something that you do frequently, you might want to look into creating your own theme. While this is quite a bit of upfront work and includes importing JSON files, it might be worth your time if you are repeatedly changing file sizes all the time.
I won’t go into how to create your own theme in this post, but let me show you where to access that information. From the Home tab on the Ribbon, select the drop-down menu for Switch Theme. The last option in that menu is a help article called How to create a theme.
7. Use Focus Mode to enlarge the visual and font size.
In the top righthand corner of each visual is a button that takes you to Focus Mode for that particular visual. Selecting that button zooms you in and focuses on just that visual.
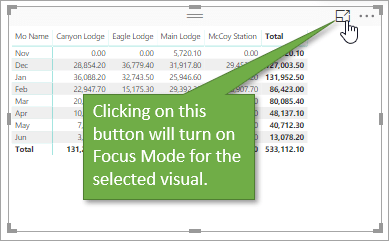
When focusing on the one visual, all of the other visuals on the page will disappear until you exit Focus Mode. To exit you can click on Back to Report or just hit Esc.
Conclusion
So, as you can see, there are lots of options to choose from in order to create visuals that are easier on the eyes to scan and study. These tips should help improve the readability of your reports, and also save you time when changing the formatting of your visuals.
I hope this post is helpful to you. Please leave a comment below with questions or suggestions!
Ref: https://www.excelcampus.com/powerbi/page-zoom-text-size/