This article shows you how to create and manage log alerts using the alerts interface inside the Azure portal. Alert rules are defined by three components:
- Target: A specific Azure resource to monitor
- Criteria: A condition or logic to evaluate for truth. If true, the alert fires.
- Action: Specific call sent to a receiver of a notification – email, SMS, webhook etc.
The term Log Alert describes alerts where a log query in Log Analytics workspace or Application Insights is evaluated, and an alert fired if the result is true. Learn more about functionality, terminology, and types from Log alerts – Overview.
Note
Log data from a Log Analytics workspace can also be routed to the Azure Monitor metrics database. Metrics alerts have different behavior, which may be more desirable depending on the data you are working with. For information on what and how you can route logs to metrics, see Metric Alert for Logs.
Create a log alert rule with the Azure portal
- In the portal, select Monitor. In that section, choose Alerts.
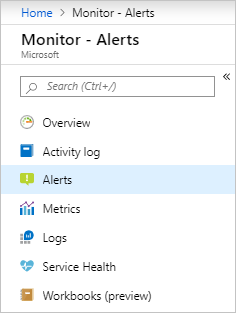
- Click New Alert Rule.

- The Create Alert pane appears. It has four parts:
- The resource to which the alert applies
- The condition to check
- The action to take if the condition is true
- The details to name and describe the alert.
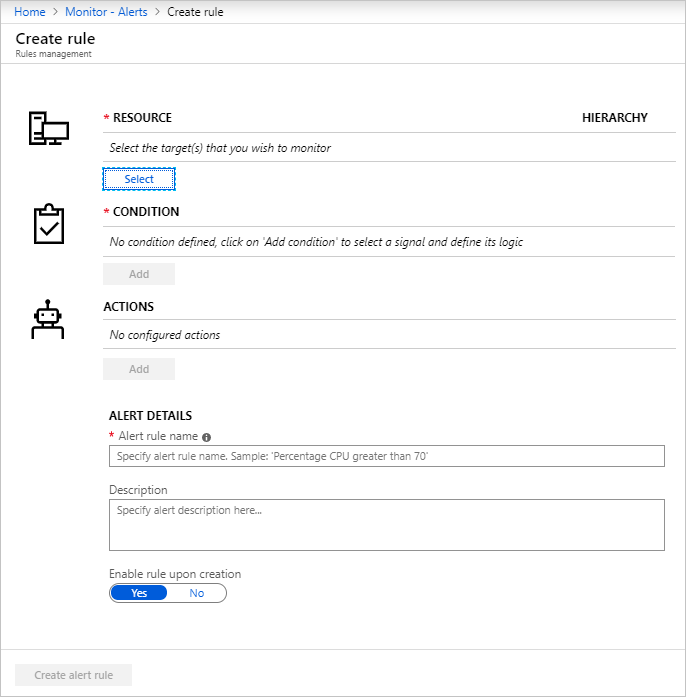
- Define the alert condition by using the Select Resource link and specifying the target by selecting a resource. Filter by choosing the Subscription, Resource Type, and required Resource.

- Ensure Resource Type is an analytics source like Log Analytics or Application Insights and signal type as Log. Click Done. Next use the Add criteria button to view list of signal options available for the resource. Find and choose Custom log search option for either Log Analytics or Application Insights, depending on where the data for your log alerts resides.
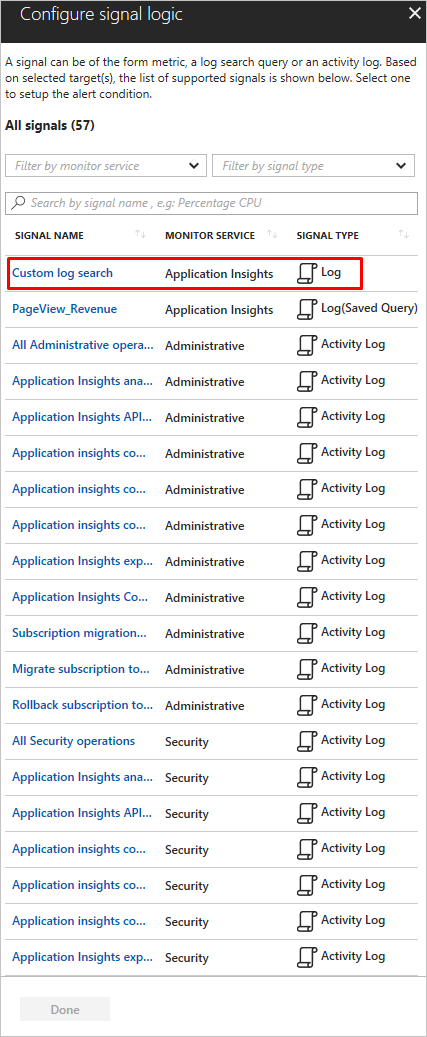 NoteAlerts lists can import analytics query as signal type – Log (Saved Query), as seen in above illustration. So users can perfect your query in Analytics and then save them for future use in alerts. For more details on using saved queries, see using log query in Azure Monitor and shared query in Application Insights analytics.
 - Once selected, create the alerting query in the Search Query field. If the query syntax is incorrect, the field displays and error in red.
- If the query syntax is correct, then historical data for the query appears as a graph with the option to tweak the time window from last six hours to last week.
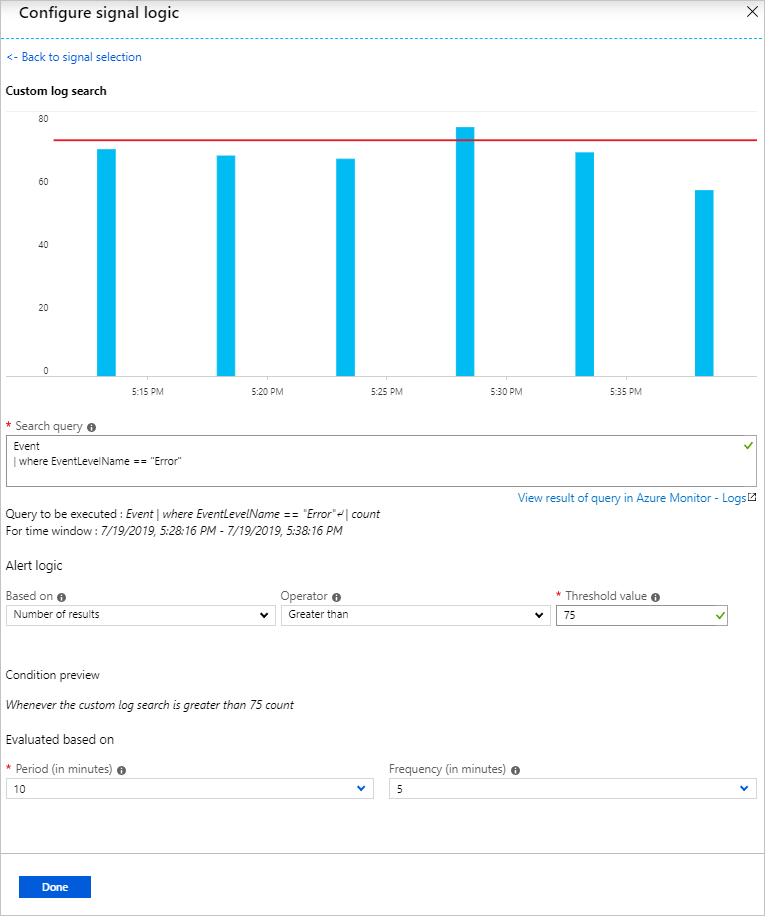 The historical data visualization is only shown if the query results have time details. If your query results in summarized data or specific column values, the display shows a single plot.For metric measurements using Application Insights or the Log Analytics API, you can specify which specific variable to group the data by using the Aggregate on option; as shown here:
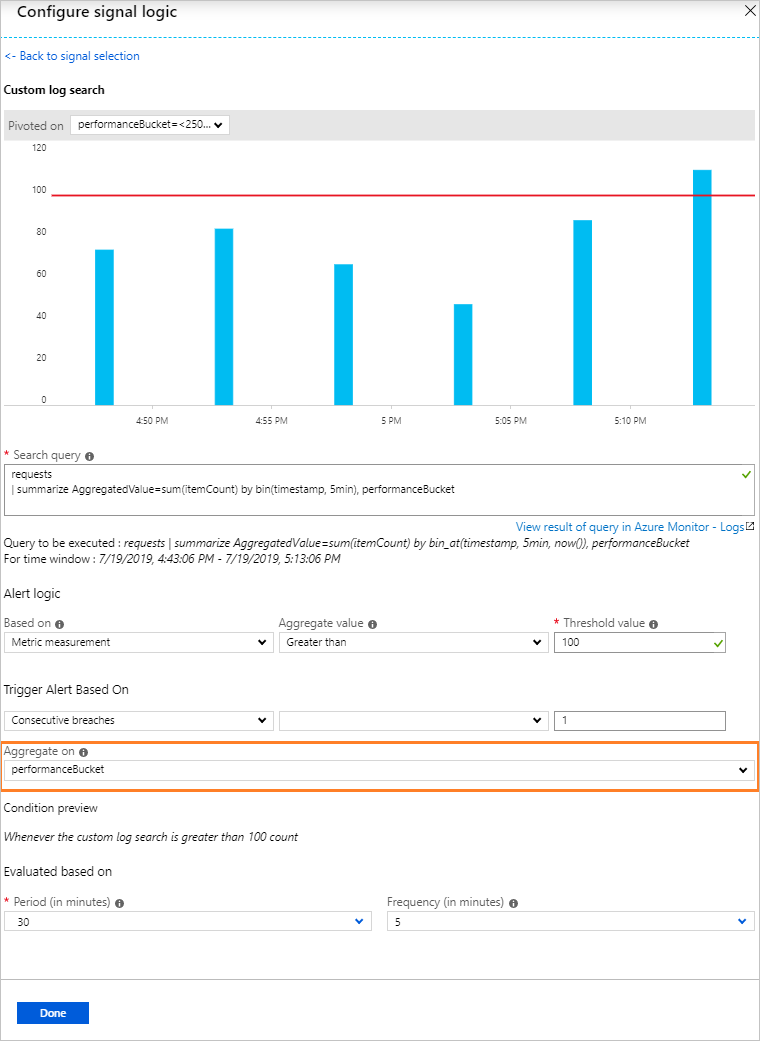
- Next choose the Alert Logic condition, aggregation and threshold.
- Choose the time period over which to assess the specified condition, using Period option.
- Choose how often the alert runs in Frequency.Log Alerts can be based on:
- Number of Records: An alert is created if the count of records returned by the query is either greater than or less than the value provided.
- Metric Measurement: An alert is created if each aggregate value in the results exceeds the threshold value provided and it is grouped by chosen value. The number of breaches for an alert is the number of times the threshold is exceeded in the chosen time period. You can specify Total breaches for any combination of breaches across the results set or Consecutive breaches to require that the breaches must occur in consecutive samples.
- Click Done.
- Define a name for your alert in the Alert rule name field along with a Description detailing specifics for the alert and Severity value from the options provided. These details are reused in all alert emails, notifications, or pushes done by Azure Monitor. Additionally, you can choose to immediately activate the alert rule on creation by clicking Enable rule upon creation.
- Choose if you want to Suppress Alerts for a period of time. When you turn on suppression for the alert rule, actions for the rule are disabled for a defined length of time after creating a new alert. The rule still runs and creates alert records provided the criteria is met. This setting allows you time to correct the problem without running duplicate actions.
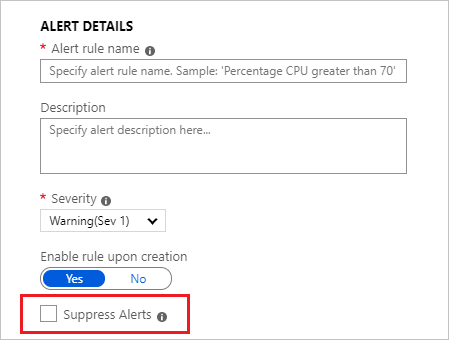 TipSpecify a suppress alert value greater than the frequency of alert to ensure notifications are stopped without overlap
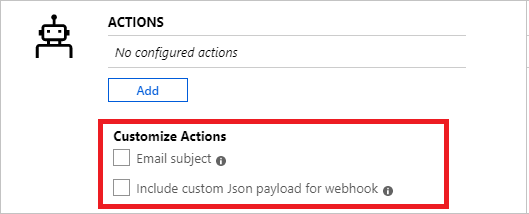
 - As the third and final step, specify if the alert rule should trigger one or more Action Group when alert condition is met. You can choose any existing Action Group or create a new one. With action groups, you can send perform a number of actions such as send email(s), send SMS(s), call Webhook(s), remediate using Azure Runbooks, push to your ITSM tool, and more. Learn more about Action Groups. NoteRefer to the Azure subscription service limits for limits on the actions that can be performed.Some additional functionality is available to override the default Actions:
- Email Notification: Overrides e-mail subject in the email sent via the Action Group. You cannot modify the body of the mail and this field is not for email address.
- Include custom Json payload: Overrides the webhook JSON used by Action Groups assuming the action group contains a webhook type. For more information on webhook formats, see webhook action for Log Alerts. View Webhook option is provided to check format using sample JSON data.
- If all fields are valid and with green tick the create alert rule button can be clicked and an alert is created in Azure Monitor – Alerts. All alerts can be viewed from the alerts Dashboard.
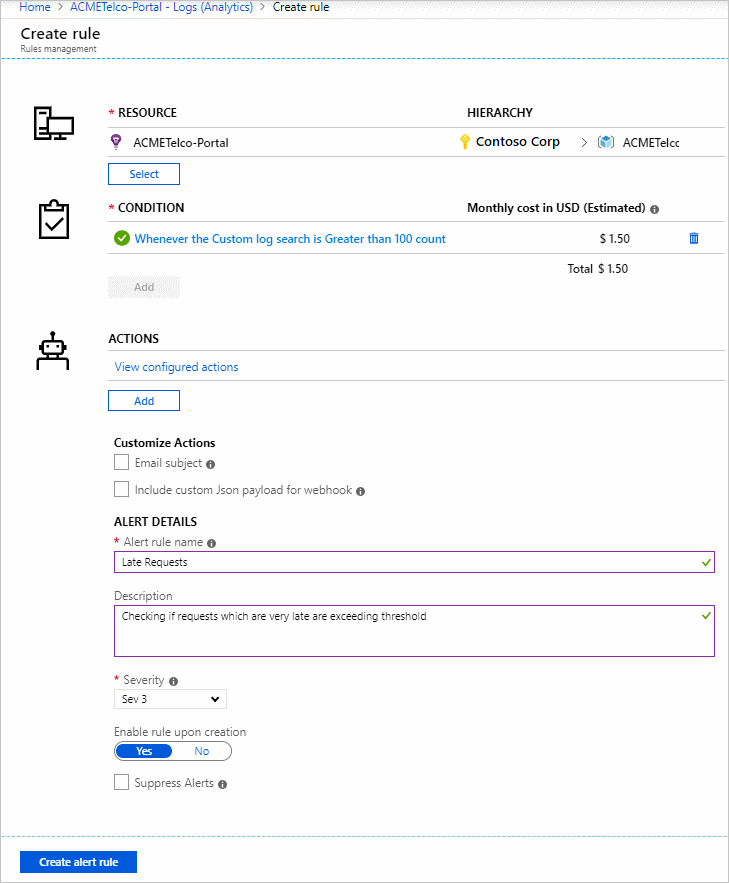 Within a few minutes, the alert is active and triggers as previously described.
Users can also finalize their analytics query in log analytics and then push it to create an alert via ‘Set Alert’ button – then following instructions from Step 6 onwards in the above tutorial.

View & manage log alerts in Azure portal
- In the portal, select Monitor and under the MONITOR section – choose Alerts.
- The Alerts Dashboard is displayed – wherein all Azure Alerts (including log alerts) are displayed in a singular board; including every instance of when your log alert rule has fired. To learn more, see Alert Management. NoteLog alert rules comprise of custom query-based logic provided by users and hence without a resolved state. Due to which every time the conditions specified in the log alert rule are met, it is fired.
- Select the Manage rules button on the top bar, to navigate to the rule management section – where all alert rules created are listed; including alerts that have been disabled.

Managing log alerts using Azure Resource Template
Log alerts in Azure Monitor are associated with resource type Microsoft.Insights/scheduledQueryRules/. For more information on this resource type, see Azure Monitor – Scheduled Query Rules API reference. Log alerts for Application Insights or Log Analytics, can be created using Scheduled Query Rules API.
Note
Log alerts for Log Analytics can also be managed using legacy Log Analytics Alert API and legacy templates of Log Analytics saved searches and alerts as well. For more information on using the new ScheduledQueryRules API detailed here by default, see Switch to new API for Log Analytics Alerts.
Sample Log alert creation using Azure Resource Template
The following is the structure for Scheduled Query Rules creation based resource template using standard log search query of number of results type log alert, with sample data set as variables.JSONCopy
{
    "$schema": "https://schema.management.azure.com/schemas/2015-01-01/deploymentTemplate.json#",
    "contentVersion": "1.0.0.0",
    "parameters": {
    },
    "variables": {
        "alertLocation": "southcentralus",
        "alertName": "samplelogalert",
        "alertDescription": "Sample log search alert",
        "alertStatus": "true",
        "alertSource":{
            "Query":"requests",
            "SourceId": "/subscriptions/a123d7efg-123c-1234-5678-a12bc3defgh4/resourceGroups/myRG/providers/microsoft.insights/components/sampleAIapplication",
            "Type":"ResultCount"
        },
        "alertSchedule":{
            "Frequency": 15,
            "Time": 60
        },
        "alertActions":{
            "SeverityLevel": "4"
        },
        "alertTrigger":{
            "Operator":"GreaterThan",
            "Threshold":"1"
        },
        "actionGrp":{
            "ActionGroup": "/subscriptions/a123d7efg-123c-1234-5678-a12bc3defgh4/resourceGroups/myRG/providers/microsoft.insights/actiongroups/sampleAG",
            "Subject": "Customized Email Header",
            "Webhook": "{ \"alertname\":\"#alertrulename\", \"IncludeSearchResults\":true }"
        }
    },
    "resources":[ {
        "name":"[variables('alertName')]",
        "type":"Microsoft.Insights/scheduledQueryRules",
        "apiVersion": "2018-04-16",
        "location": "[variables('alertLocation')]",
        "properties":{
            "description": "[variables('alertDescription')]",
            "enabled": "[variables('alertStatus')]",
            "source": {
                "query": "[variables('alertSource').Query]",
                "dataSourceId": "[variables('alertSource').SourceId]",
                "queryType":"[variables('alertSource').Type]"
            },
            "schedule":{
                "frequencyInMinutes": "[variables('alertSchedule').Frequency]",
                "timeWindowInMinutes": "[variables('alertSchedule').Time]"
            },
            "action":{
                "odata.type": "Microsoft.WindowsAzure.Management.Monitoring.Alerts.Models.Microsoft.AppInsights.Nexus.DataContracts.Resources.ScheduledQueryRules.AlertingAction",
                "severity":"[variables('alertActions').SeverityLevel]",
                "aznsAction":{
                    "actionGroup":"[array(variables('actionGrp').ActionGroup)]",
                    "emailSubject":"[variables('actionGrp').Subject]",
                    "customWebhookPayload":"[variables('actionGrp').Webhook]"
                },
                "trigger":{
                    "thresholdOperator":"[variables('alertTrigger').Operator]",
                    "threshold":"[variables('alertTrigger').Threshold]"
                }
            }
        }
    } ]
}
The sample json above can be saved as (say) sampleScheduledQueryRule.json for the purpose of this walk through and can be deployed using Azure Resource Manager in Azure portal.
Log alert with cross-resource query using Azure Resource Template
The following is the structure for Scheduled Query Rules creation based resource template using cross-resource log search query of metric measurement type log alert, with sample data set as variables.JSONCopy
{
    "$schema": "https://schema.management.azure.com/schemas/2015-01-01/deploymentTemplate.json#",
    "contentVersion": "1.0.0.0",
    "parameters": {
    },
    "variables": {
        "alertLocation": "Region Name for your Application Insights App or Log Analytics Workspace",
        "alertName": "sample log alert",
        "alertDescr": "Sample log search alert",
        "alertStatus": "true",
        "alertSource":{
            "Query":"union workspace(\"servicews\").Update, app('serviceapp').requests | summarize AggregatedValue = count() by bin(TimeGenerated,1h), Classification",
            "Resource1": "/subscriptions/a123d7efg-123c-1234-5678-a12bc3defgh4/resourceGroups/contosoRG/providers/microsoft.OperationalInsights/workspaces/servicews",
            "Resource2": "/subscriptions/a123d7efg-123c-1234-5678-a12bc3defgh4/resourceGroups/contosoRG/providers/microsoft.insights/components/serviceapp",
            "SourceId": "/subscriptions/a123d7efg-123c-1234-5678-a12bc3defgh4/resourceGroups/contosoRG/providers/microsoft.OperationalInsights/workspaces/servicews",
            "Type":"ResultCount"
        },
        "alertSchedule":{
            "Frequency": 15,
            "Time": 60
        },
        "alertActions":{
            "SeverityLevel": "4",
            "SuppressTimeinMin": 20
        },
        "alertTrigger":{
            "Operator":"GreaterThan",
            "Threshold":"1"
        },
        "metricMeasurement": {
            "thresholdOperator": "Equal",
            "threshold": "1",
            "metricTriggerType": "Consecutive",
            "metricColumn": "Classification"
        },
        "actionGrp":{
            "ActionGroup": "/subscriptions/a123d7efg-123c-1234-5678-a12bc3defgh4/resourceGroups/contosoRG/providers/microsoft.insights/actiongroups/sampleAG",
            "Subject": "Customized Email Header",
            "Webhook": "{ \"alertname\":\"#alertrulename\", \"IncludeSearchResults\":true }"
        }
    },
    "resources":[ {
        "name":"[variables('alertName')]",
        "type":"Microsoft.Insights/scheduledQueryRules",
        "apiVersion": "2018-04-16",
        "location": "[variables('alertLocation')]",
        "properties":{
            "description": "[variables('alertDescr')]",
            "enabled": "[variables('alertStatus')]",
            "source": {
                "query": "[variables('alertSource').Query]",
                "authorizedResources": "[concat(array(variables('alertSource').Resource1), array(variables('alertSource').Resource2))]",
                "dataSourceId": "[variables('alertSource').SourceId]",
                "queryType":"[variables('alertSource').Type]"
            },
            "schedule":{
                "frequencyInMinutes": "[variables('alertSchedule').Frequency]",
                "timeWindowInMinutes": "[variables('alertSchedule').Time]"
            },
            "action":{
                "odata.type": "Microsoft.WindowsAzure.Management.Monitoring.Alerts.Models.Microsoft.AppInsights.Nexus.DataContracts.Resources.ScheduledQueryRules.AlertingAction",
                "severity":"[variables('alertActions').SeverityLevel]",
                "throttlingInMin": "[variables('alertActions').SuppressTimeinMin]",
                "aznsAction":{
                    "actionGroup": "[array(variables('actionGrp').ActionGroup)]",
                    "emailSubject":"[variables('actionGrp').Subject]",
                    "customWebhookPayload":"[variables('actionGrp').Webhook]"
                },
                "trigger":{
                    "thresholdOperator":"[variables('alertTrigger').Operator]",
                    "threshold":"[variables('alertTrigger').Threshold]",
                    "metricTrigger":{
                        "thresholdOperator": "[variables('metricMeasurement').thresholdOperator]",
                        "threshold": "[variables('metricMeasurement').threshold]",
                        "metricColumn": "[variables('metricMeasurement').metricColumn]",
                        "metricTriggerType": "[variables('metricMeasurement').metricTriggerType]"
                    }
                }
            }
        }
    } ]
}
Important
When using cross-resource query in log alert, the usage of authorizedResources is mandatory and user must have access to the list of resources stated
The sample json above can be saved as (say) sampleScheduledQueryRule.json for the purpose of this walk through and can be deployed using Azure Resource Manager in Azure portal.
Managing log alerts using PowerShell
Note
This article has been updated to use the new Azure PowerShell Az module. You can still use the AzureRM module, which will continue to receive bug fixes until at least December 2020. To learn more about the new Az module and AzureRM compatibility, see Introducing the new Azure PowerShell Az module. For Az module installation instructions, see Install Azure PowerShell.
Azure Monitor – Scheduled Query Rules API is a REST API and fully compatible with Azure Resource Manager REST API. And PowerShell cmdlets listed below are available to leverage the Scheduled Query Rules API.
- New-AzScheduledQueryRule : PowerShell cmdlet to create a new log alert rule.
- Set-AzScheduledQueryRule : PowerShell cmdlet to update an existing log alert rule.
- New-AzScheduledQueryRuleSource : PowerShell cmdlet to create or update object specifying source parameters for a log alert. Used as input by New-AzScheduledQueryRule and Set-AzScheduledQueryRule cmdlet.
- New-AzScheduledQueryRuleSchedule: PowerShell cmdlet to create or update object specifying schedule parameters for a log alert. Used as input by New-AzScheduledQueryRule and Set-AzScheduledQueryRule cmdlet.
- New-AzScheduledQueryRuleAlertingAction : PowerShell cmdlet to create or update object specifying action parameters for a log alert. Used as input by New-AzScheduledQueryRule and Set-AzScheduledQueryRule cmdlet.
- New-AzScheduledQueryRuleAznsActionGroup : PowerShell cmdlet to create or update object specifying action groups parameters for a log alert. Used as input by New-AzScheduledQueryRuleAlertingAction cmdlet.
- New-AzScheduledQueryRuleTriggerCondition : PowerShell cmdlet to create or update object specifying trigger condition parameters for log alert. Used as input by New-AzScheduledQueryRuleAlertingAction cmdlet.
- New-AzScheduledQueryRuleLogMetricTrigger : PowerShell cmdlet to create or update object specifying metric trigger condition parameters for metric measurement type log alert. Used as input by New-AzScheduledQueryRuleTriggerCondition cmdlet.
- Get-AzScheduledQueryRule : PowerShell cmdlet to list existing log alert rules or a specific log alert rule
- Update-AzScheduledQueryRule : PowerShell cmdlet to enable or disable log alert rule
- Remove-AzScheduledQueryRule: PowerShell cmdlet to delete an existing log alert rule
Note
ScheduledQueryRules PowerShell cmdlets can only manage rules created cmdlet itself or using Azure Monitor – Scheduled Query Rules API. Log alert rules created using legacy Log Analytics Alert API and legacy templates of Log Analytics saved searches and alerts can be managed using ScheduledQueryRules PowerShell cmdlets only after user switches API preference for Log Analytics Alerts.
Illustrated next are the steps for creation of a sample log alert rule using the scheduledQueryRules PowerShell cmdlets.PowerShellCopy
$source = New-AzScheduledQueryRuleSource -Query 'Heartbeat | summarize AggregatedValue = count() by bin(TimeGenerated, 5m), _ResourceId' -DataSourceId "/subscriptions/a123d7efg-123c-1234-5678-a12bc3defgh4/resourceGroups/contosoRG/providers/microsoft.OperationalInsights/workspaces/servicews"

$schedule = New-AzScheduledQueryRuleSchedule -FrequencyInMinutes 15 -TimeWindowInMinutes 30

$metricTrigger = New-AzScheduledQueryRuleLogMetricTrigger -ThresholdOperator "GreaterThan" -Threshold 2 -MetricTriggerType "Consecutive" -MetricColumn "_ResourceId"

$triggerCondition = New-AzScheduledQueryRuleTriggerCondition -ThresholdOperator "LessThan" -Threshold 5 -MetricTrigger $metricTrigger

$aznsActionGroup = New-AzScheduledQueryRuleAznsActionGroup -ActionGroup "/subscriptions/a123d7efg-123c-1234-5678-a12bc3defgh4/resourceGroups/contosoRG/providers/microsoft.insights/actiongroups/sampleAG" -EmailSubject "Custom email subject" -CustomWebhookPayload "{ `"alert`":`"#alertrulename`", `"IncludeSearchResults`":true }"

$alertingAction = New-AzScheduledQueryRuleAlertingAction -AznsAction $aznsActionGroup -Severity "3" -Trigger $triggerCondition

New-AzScheduledQueryRule -ResourceGroupName "contosoRG" -Location "Region Name for your Application Insights App or Log Analytics Workspace" -Action $alertingAction -Enabled $true -Description "Alert description" -Schedule $schedule -Source $source -Name "Alert Name"
Managing log alerts using CLI or API
Azure Monitor – Scheduled Query Rules API is a REST API and fully compatible with Azure Resource Manager REST API. Hence it can be used via Powershell using Resource Manager commands for Azure CLI.
Note
Log alerts for Log Analytics can also be managed using legacy Log Analytics Alert API and legacy templates of Log Analytics saved searches and alerts as well. For more information on using the new ScheduledQueryRules API detailed here by default, see Switch to new API for Log Analytics Alerts.
Log alerts currently do not have dedicated CLI commands currently; but as illustrated below can be used via Azure Resource Manager CLI command for sample Resource Template shown earlier (sampleScheduledQueryRule.json) in the Resource Template section:Azure CLICopy
az group deployment create --resource-group contosoRG --template-file sampleScheduledQueryRule.json
On successful operation, 201 will be returned to state new alert rule creation or 200 will be returned if an existing alert rule was modified.
Next steps
- Learn about Log Alerts in Azure Alerts
- Understand Webhook actions for log alerts
- Learn more about Application Insights
- Learn more about log queries.
Ref: https://docs.microsoft.com/en-us/azure/azure-monitor/platform/alerts-log